How can I predict the stability of any structure by using MP?
2 Likes
Can you elaborate on what you’re looking for? Specifically, are you looking for how to access stability data that’s already in MP (i.e. for a structure that you can find on the website or via the API), or how to estimate the stability of a structure that you don’t know the entry for or doesn’t exist in the MP database?
In general, the stability of a given material in our database is provided in the e_above_hull field on either the website or via the api.
1 Like
Thank you so much for your response.
I was curious about the structure that doesn’t exists in MP.
Also, I have a small question about e_above_hull in MP. If this value is 0 for any structure, does that mean the structure is always stable?
Thank’s again.
Of course, happy to help. For the second question, if e_above_hull is 0, it means the structure is stable with respect to decomposition at the same, fixed composition. See “Energy above hull” in our glossary, which explains in a bit more detail. If you’ve got an open system to one element, for example, the stability profile might be a bit different, and depends on the chemical potential of the open element.
The first question is a bit more complicated. The energies above hull for each material are generated using the phase diagram code in pymatgen. To do this, you basically need some expression of the potential energy of the material that’s consistent with the MP dataset. We don’t have a scheme for predicting the potential energy of an arbitrary structure, but you could do it three different ways in my mind.
1). Submit your structure to MPComplete via the Crystal Toolkit. There’s a bit of a backlog in MPComplete right now due to our DB infrastructure transfer that’s ongoing, and there’s at least some probability that the calculation will fail, but if it’s successful, the result will eventually be added to the website with the appropriate stability data.
2). If you’re able to do a VASP calculation, you can use either atomate or VASP directly with pymatgen’s input sets to perform a DFT calculation that should be equivalent to what we’ve done. Using the output of the VASP data, you can process the resultant ComputedEntry using the MaterialsProjectCompatibility class of pymatgen’s compatibility module, and then generate your own phase diagram.
3). If you know the heat of formation of your compound or the heat of reaction from some other set of known compounds already in MP, you should also be able to generate a ComputedEntry by calculating a total energy from some set of references, rather than doing a VASP calculation.
5 Likes
Thank you so much for such a nice explanation. I have little bit more confusion, can you please help me to understand this in more detail.
Suppose I have a compound A1B2C3, then we will test the stability of this compounds against the decomposition say A1B2 or A1C3 or A1B or B1C1 and so on. There will be energy difference between these decomposed states and the original compound. How can we conclude from these information about the stability. I read some recommendations from you and found more helpful.
Thank you again.
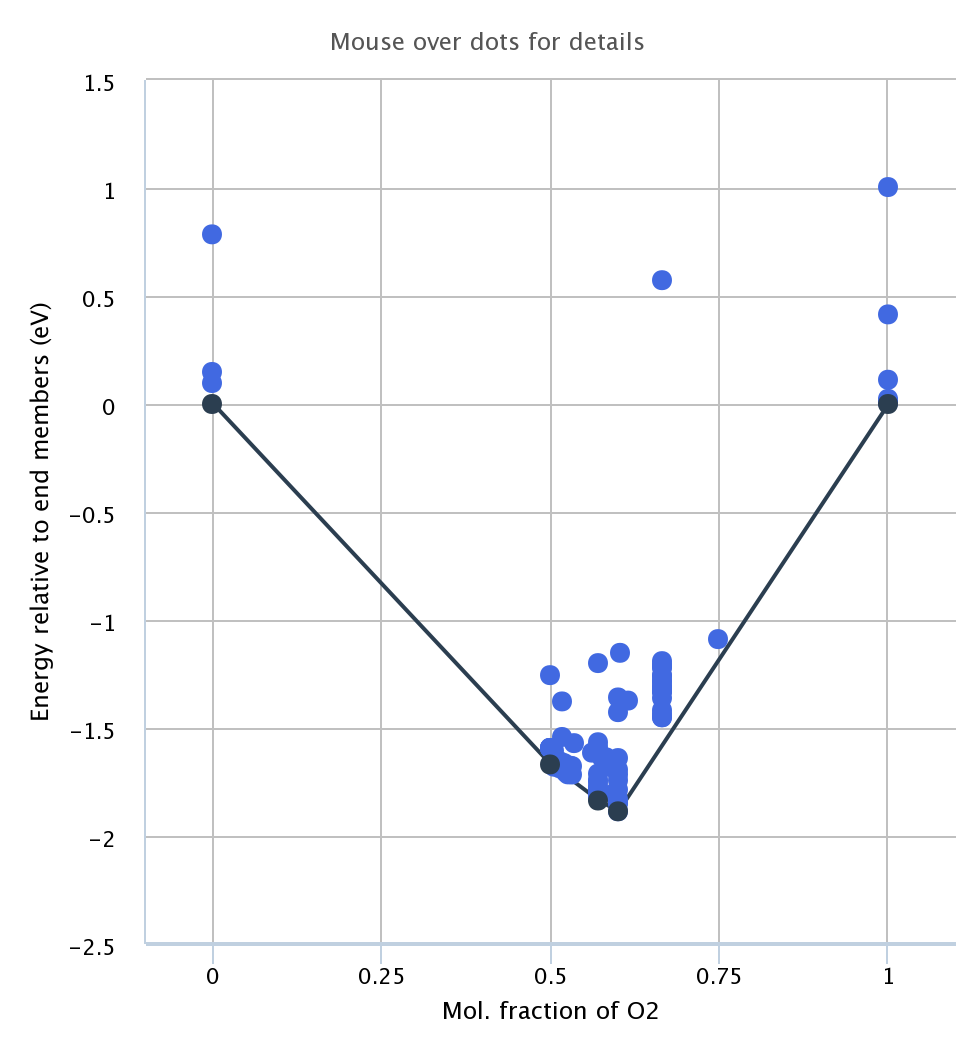
What you’ve described is basically the information that’s contained in the phase diagram. The convex hull (represented by the lines at the bottom of the phase diagram) represents the set of lowest possible potential energy states you can get from either single materials (at the black points) or mixtures of those materials (along the black lines connecting the points). If a compound is above a line in the convex hull (e.g. the lighter blue dots in the below image), it will spontaneously decompose into products on the endpoints of that line. The “energy_above_hull” for a given material is the distance from its dot in the below image and the lines connecting the black dots at the bottom.
Finding the convex hull in three dimensions is a bit more complicated in terms of geometry, but it’s the same principle except with planes connecting 3 compounds instead of lines connecting 2.
1 Like
Thank you so much for your explanation, it helped a-lot.
I am going through some literatures about this convex hull construction. I am still confused about one point. suppose, I have a compound with new phase now and it has energy lower than the hull we have above, i.e the black points. Shall, we shift that hull below to include that point or we construct new hull from that point. Here, if we shift that hull below to include that new point, then the points above which are stable (black one) will be unstable with reference to the new point.
How do we tackle this issue ?
Also, can you please have some point on the scale along x axis. We say is on fraction of some element, what does that mean and how you determine it?
Thanks again.
Yep, you’ve got it. If you found a new compound below the existing hull, the hull would shift down the way you’ve described. This happens pretty routinely when we find new structures for a given chemical system (I.e. combination of elements), and our database is updated accordingly by reconstructing the entire diagram.
The x axis is the ratio of the number of atoms of a given element (in this case O) over the total number of atoms, or the mole fraction of that element. For example, in FeO, the mole fraction is 0.5 and in Fe2O3 it’s 0.6.
1 Like
Thank you so much.
Again, just wanted to clear my understanding.
When you find new phase below the convex hull (phases on which you consider as stable before) and shift the hull to the new phase, how can we argue about the phases that were previously on the hull but now they lie above the hull ? Shall we say relative to the newly formed convex hull the previous one is unstable ? If that is the case the question may arise under similar external condition how can a phase become stable before and now unstable ?
what if we keep the previous hull and draw a new hull from this newly found phase?
Thanks in advance.
1 Like
It’s not that a phase physically becomes unstable with the integration of a new compound, it’s that our original approximation was insufficiently populated with phases in order to describe the “correct” convex hull. It was unstable all along, but we didn’t have all the compounds in our phase diagram necessary to designate it as such. Your interpretation where you say relative to the newly formed convex hull the previous one is unstable is correct. Our phase diagrams are always approximations based on the data we include, if a new phase is added that defines a new convex hull, our approximation becomes more complete.
Unless one of the endpoints changes, drawing an entirely new hull or reconstructing the hull partially from the old hull with the newly found phase are equivalent operations. We reconstruct the hull entirely when we build our database because that’s a more convenient way to implement it algorithmically, but you could do either, and they’d give the same result.
3 Likes
Thank you so much for this explanation. Now I am more clear about it.
2 Likes