Hello everyone,
I wanted to better understand the data on https://materialsproject.org/materials/mp-28117/#electronic-structure
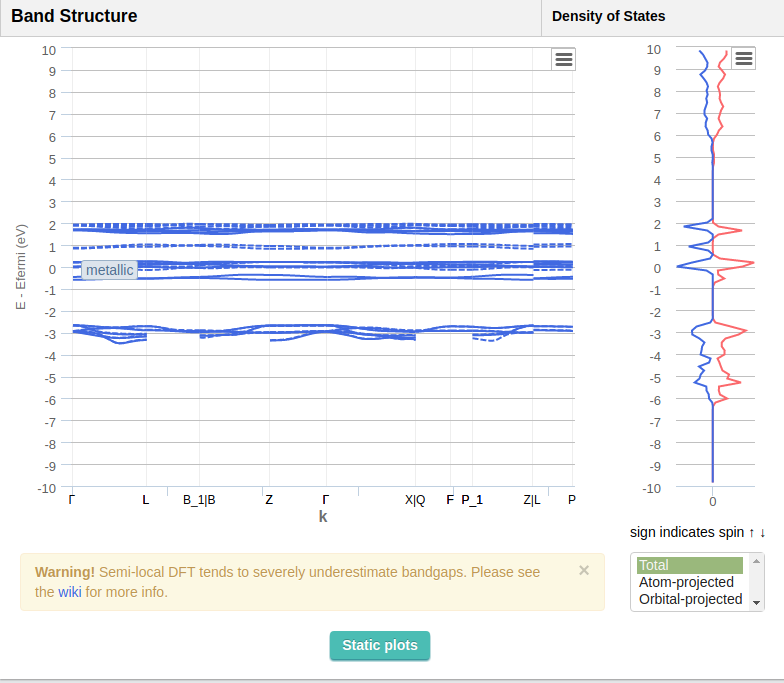
so I registered and clicked on Interactive plot, but I only saw metallic bands and no other:
Two questions:
Is it possible to see other bands, not only metallic ones?
More important: what are the meanings of coloured and styles (dashed vs. simple) in the plot?
Thanks a lot for your help!
Andrej
Hi Andrej. We should probably design this in a more intuitive way, but the bands are all there. The “metallic” text refers to the overall band gap, which is 0 in this case, and thus the material is metallic. The dashed and solid lines correspond to bands of spin -1 and 1, respectively, and similarly the DOS on the right is composed of colors that delineate opposite spins. Thanks for asking, it brings things we might want to rethink to our attention.
1 Like
Thank you very much Joseph for your answer.
I just want to make sure about following regarding the plof bandstructure as well:
When I look at the bandstructure https://materialsproject.org/materials/mp-28117/#electronic-structure
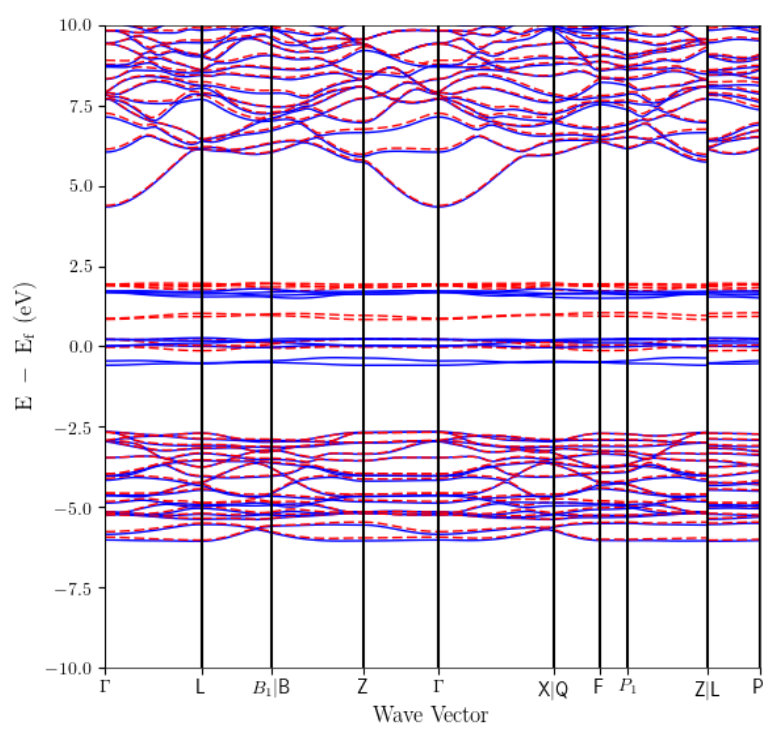
do the red lines on the plot of bandstructure correspond to the bands coming from vanadium atoms and the blue lines to bands coming from chlorine atoms? Is there a spin ±1 also showed on the plot of bandstructure via simple and dashed lines, or they is no spin component plotted on the plot of bandstructure?
Thank you very much for the answer.
Hi @andrejnacl,
For the static plots, blue solid/red dotted lines on the bandstructure plot correspond to the two spin channels, so they are the bands of opposite spin, respectively. I’m not sure whether this changed in the past 5 months or whether I just got it wrong the first time, but the DOS plot colors correspond to the atom-projected DOS (labelled in the upper right hand corner of the DOS).
Currently, when you click on the “interactive plots” option, this changes. The bandstructure is all one color (blue), but the different spins are still indicated via solid/dashed lines. The different spins in the “total” DOS are indicated by different colors, but can also be plotted in “atom-projected” (or “orbital-projected”) mode using the options at the bottom.
I think this should be changed so that the interactive plotting modes is consistent with the static plot, so I’ll filed an issue on our web code repo. I’ll follow up here if we decide to change this.
Hi,
thank your very much for your answer.
which line style corresponds to which spin channel on this unzoomed bandstructure plot then?
I think it would be great if the colour scheme was not so confusing and all plots had legends.
Blue is spin up, red dotted spin down